Scaling SaaS Risk Intelligence for Enterprise Security Teams

COMPANY
AppOmni
END USERS
Fortunue 500 clients (including Google, Barclays, Accenture, Principal, PepsiCo)

Executive Summary (for recruiters)

Enterprise security teams often operate with fragmented visibility into SaaS usage, making it difficult to identify shadow IT, assess risk, and act quickly.

At AppOmni, I led the design of a SaaS visibility and risk intelligence system that transformed raw browser telemetry into actionable insights for enterprise security teams, including Fortune 500 customers.

My contributions included:

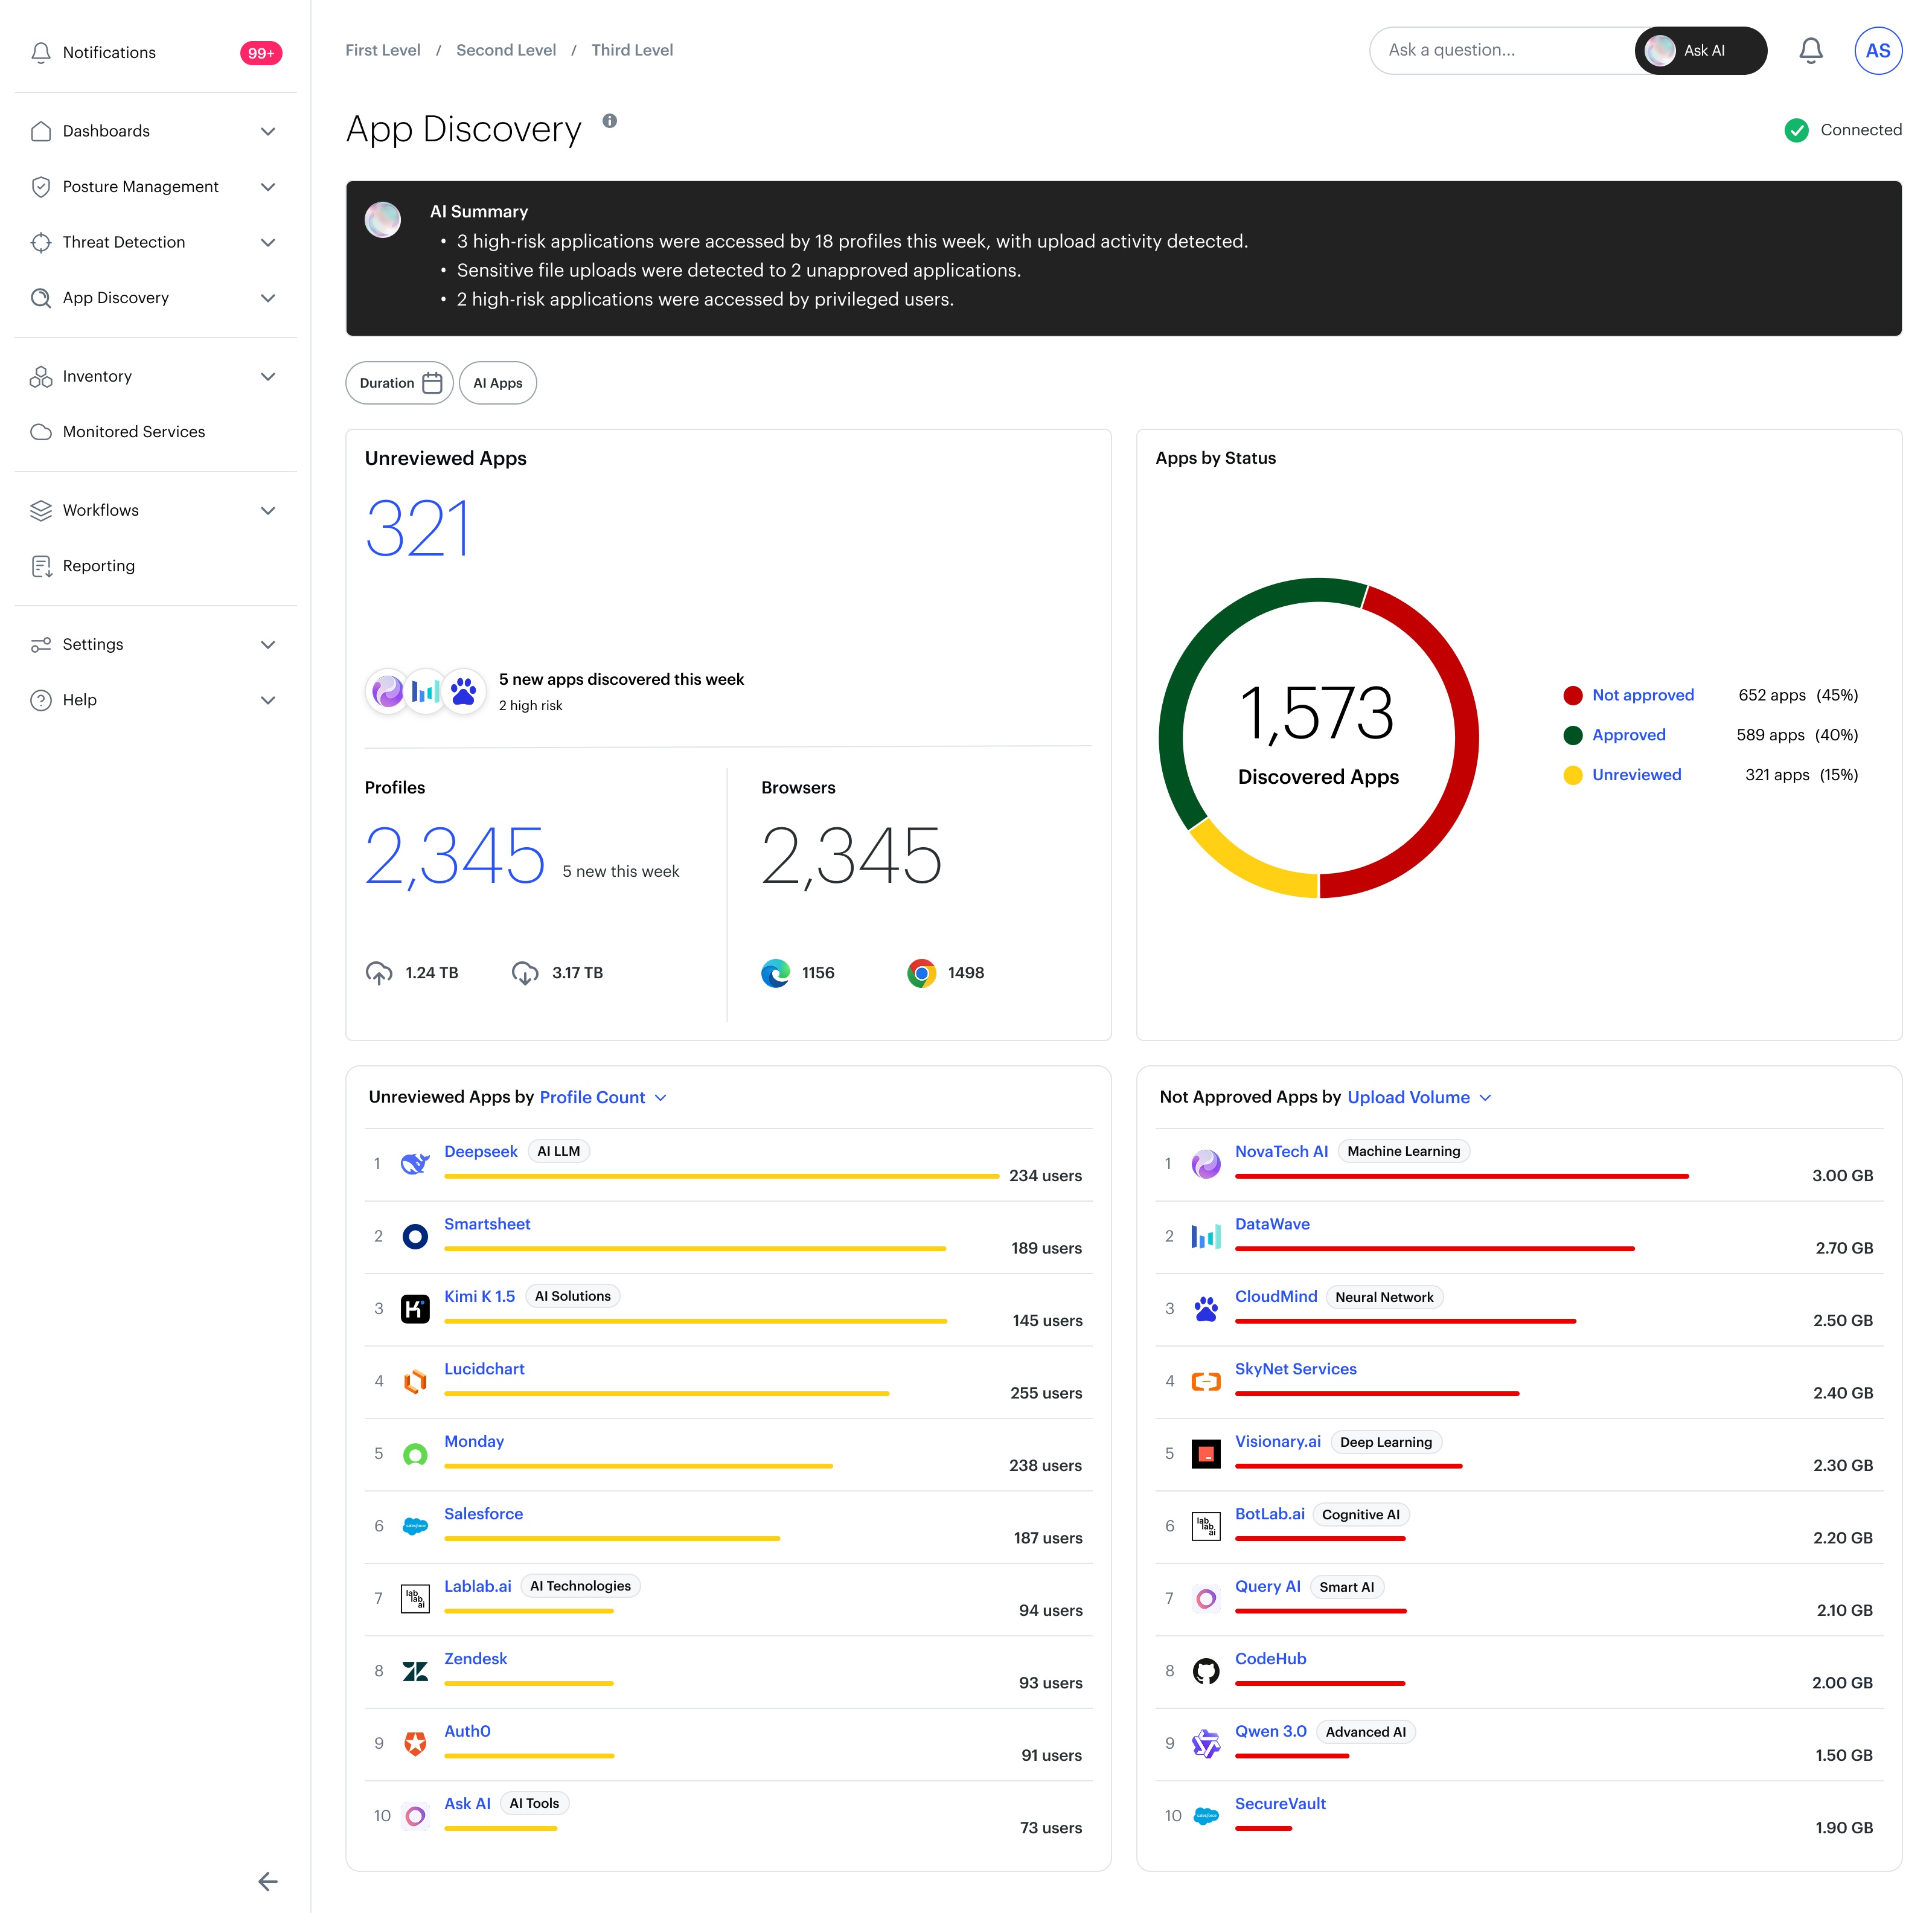
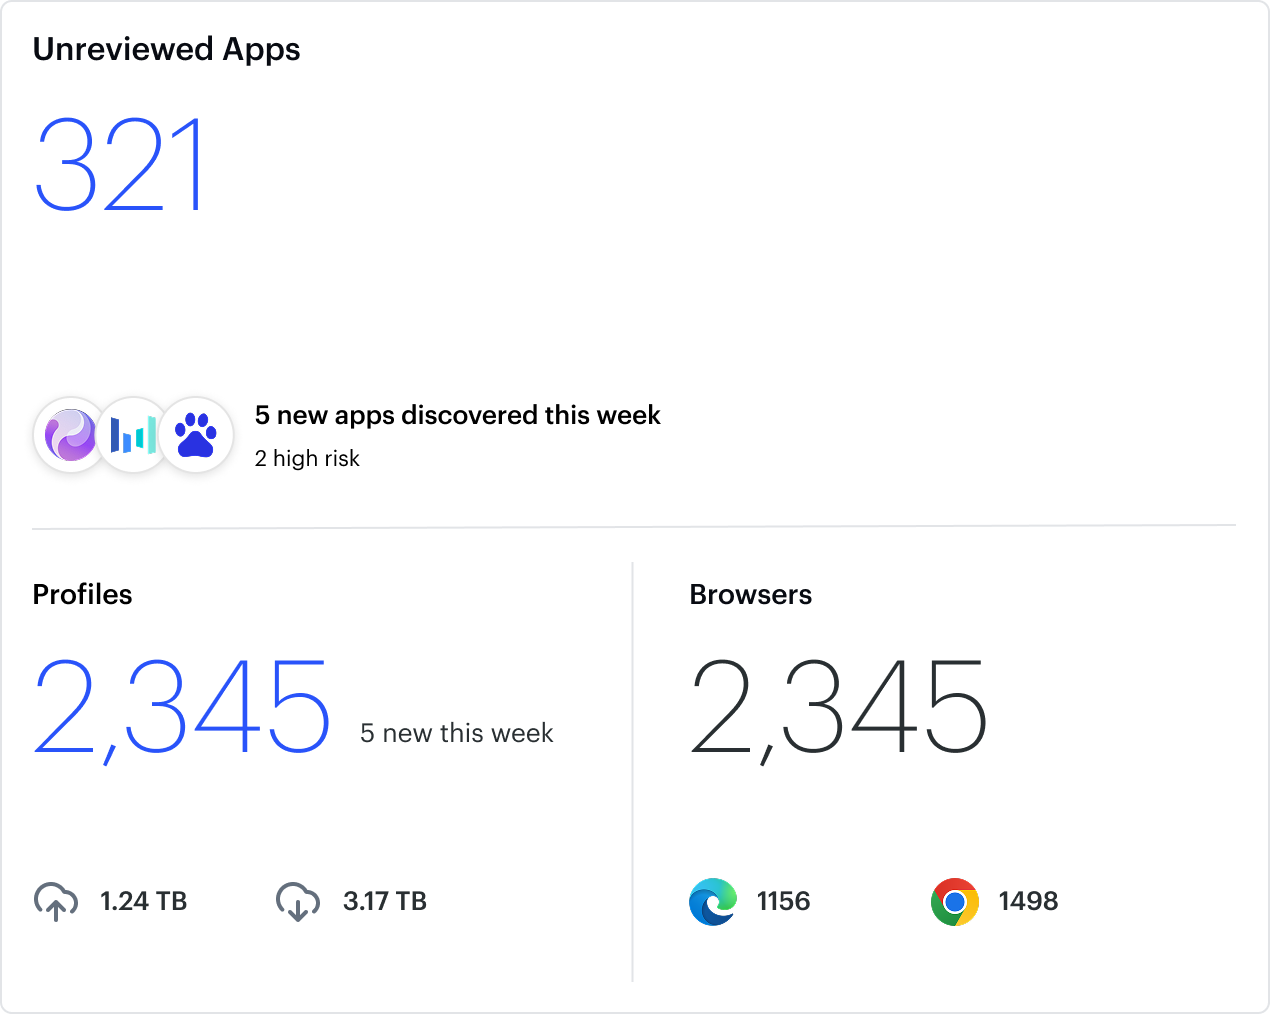
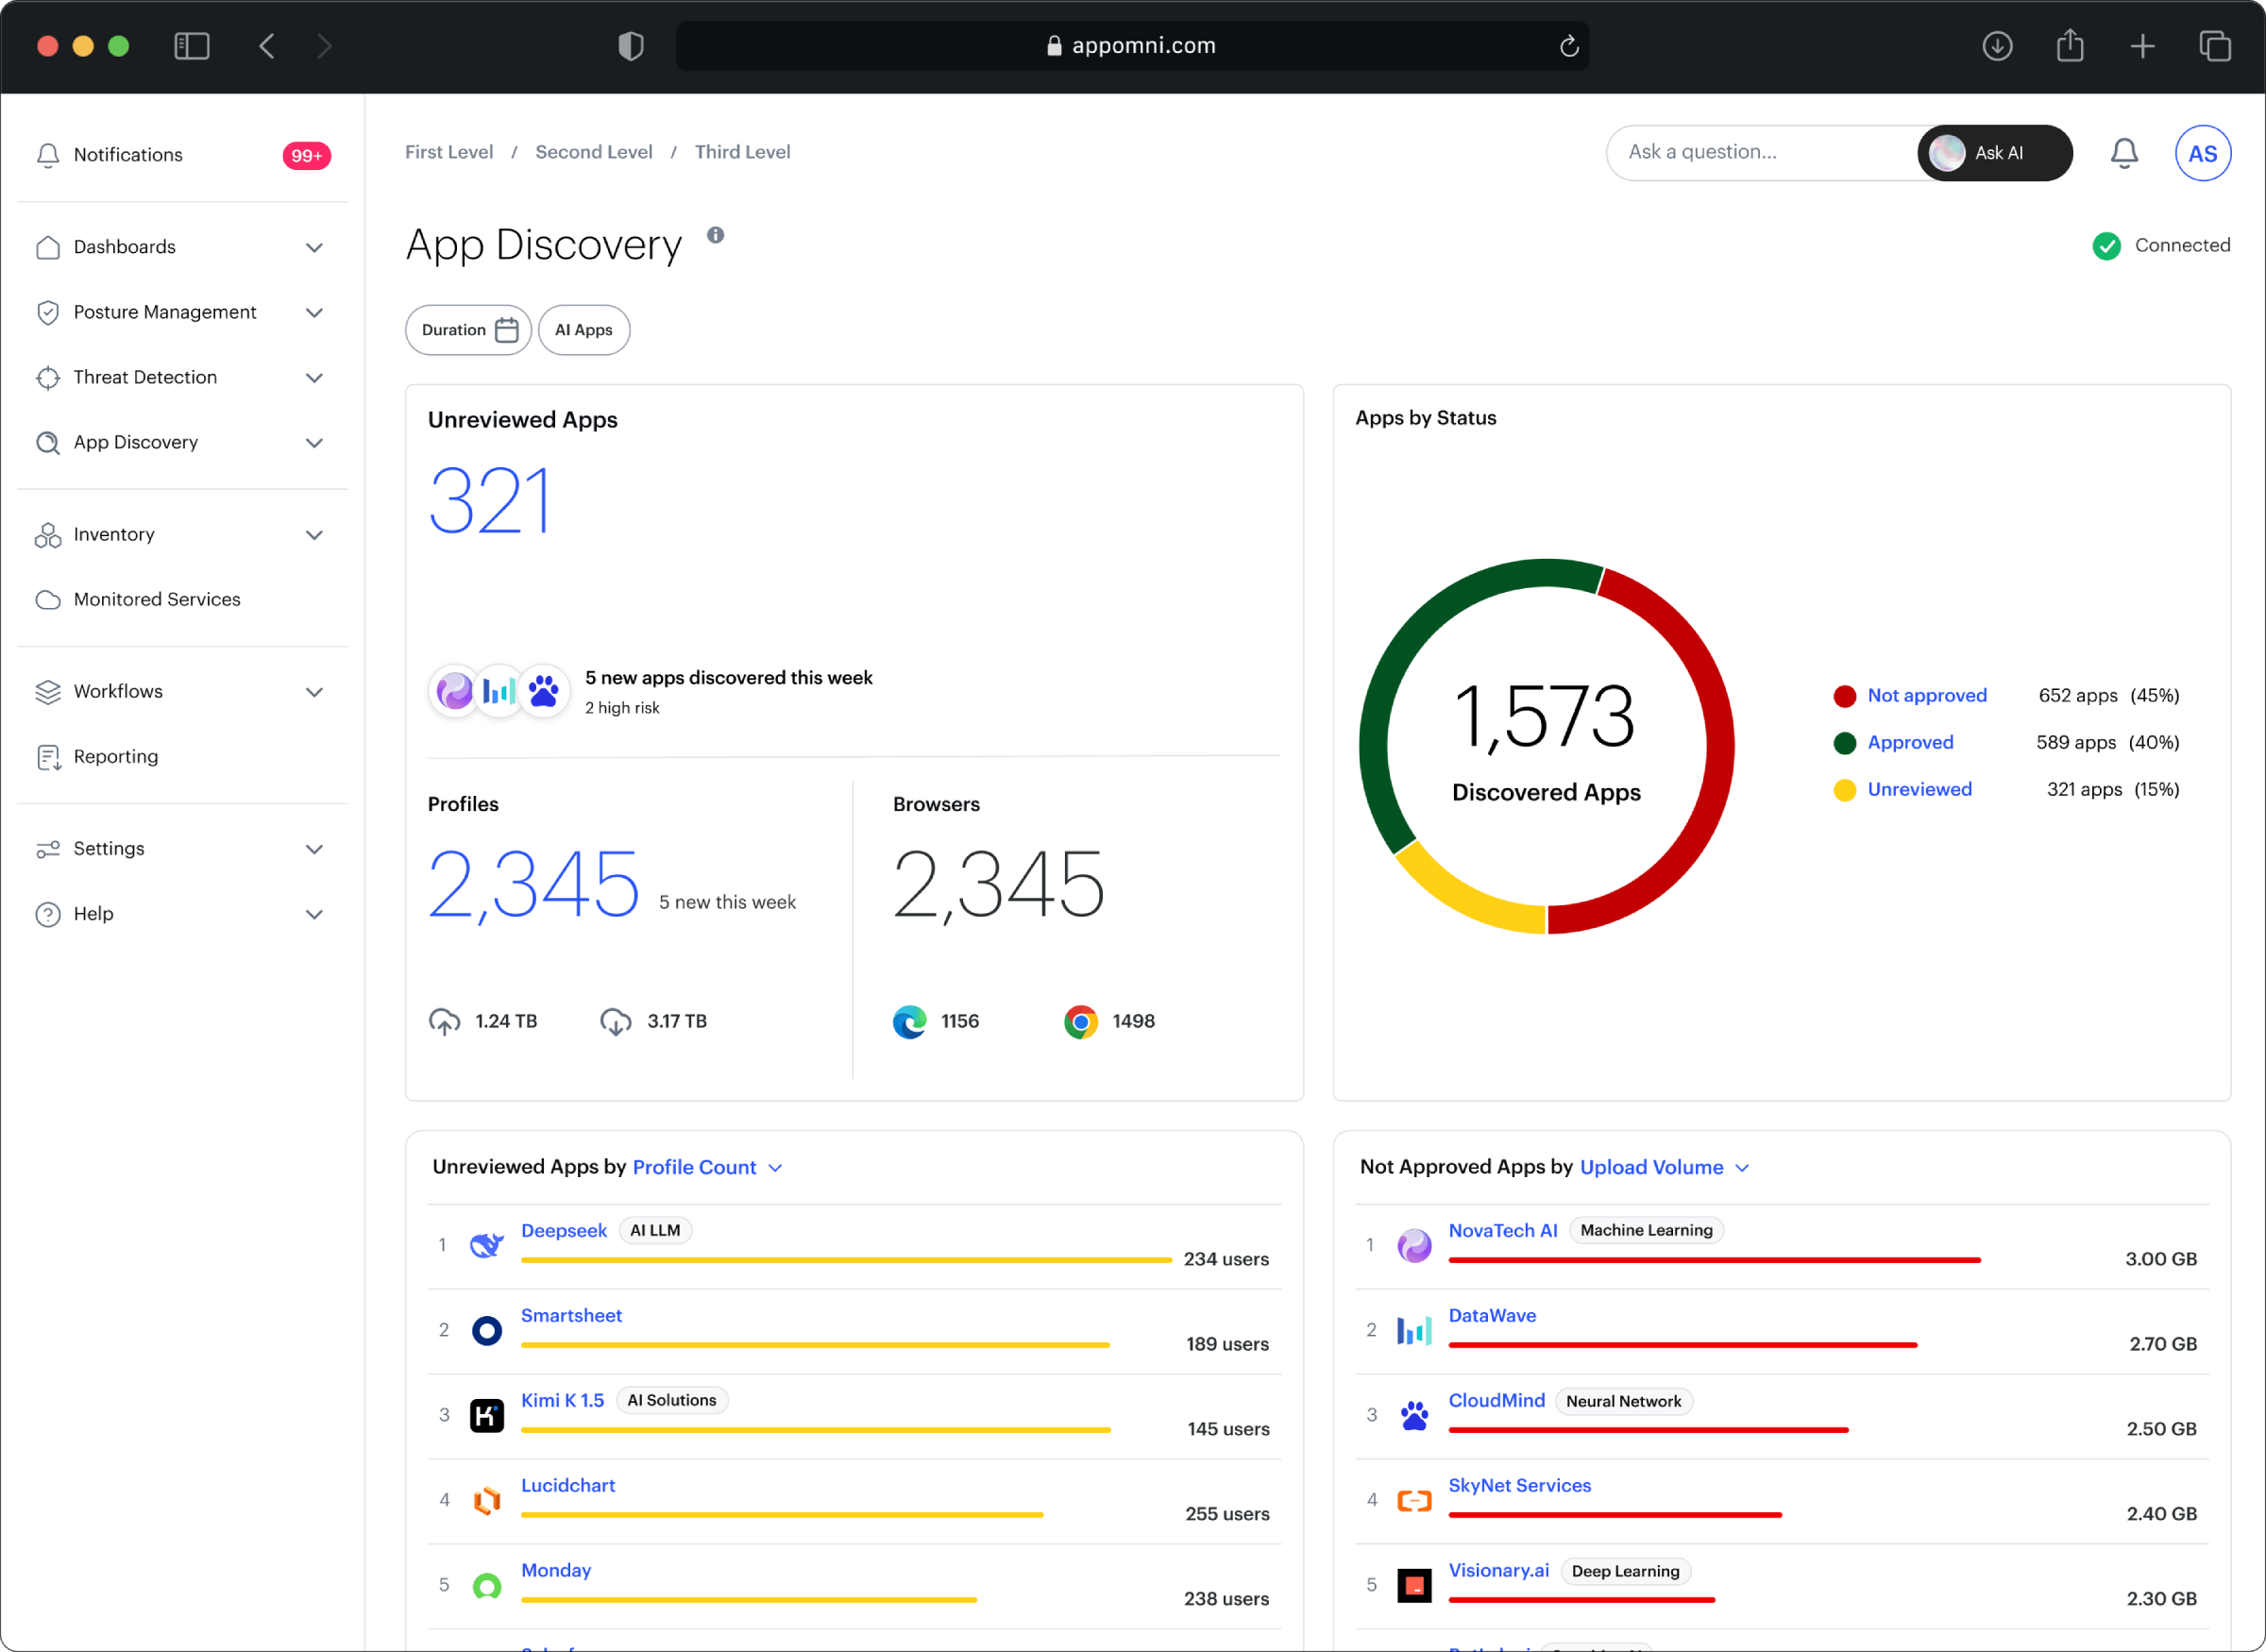
1. Defining key product metrics such as high-risk applications and newly discovered apps

2. Introducing an AI-powered insights layer to surface risks and anomalies instantly

3. Designing a data-driven dashboard architecture to reduce time-to-insight

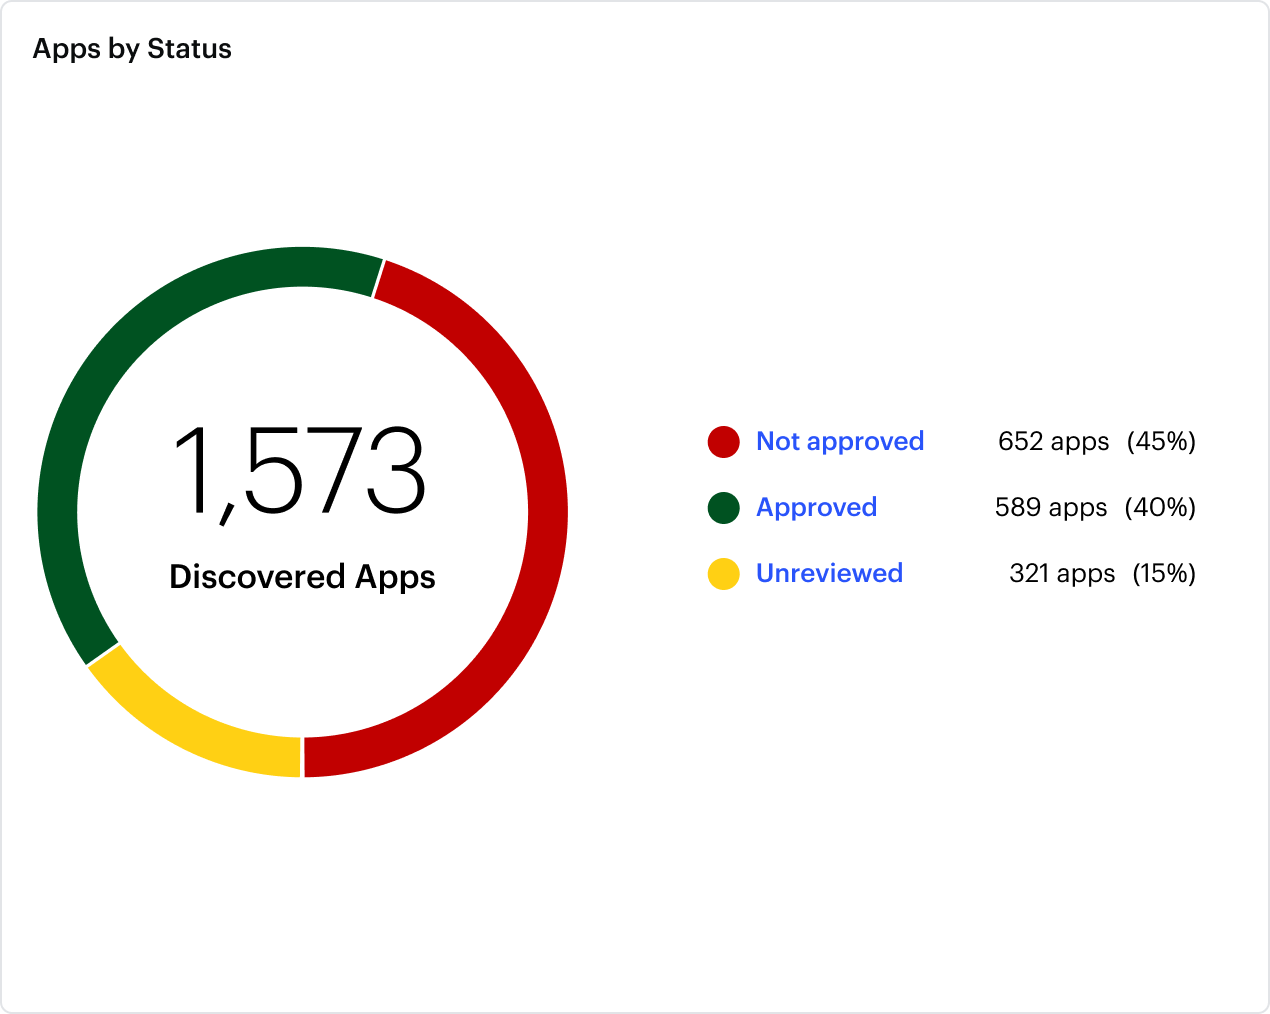
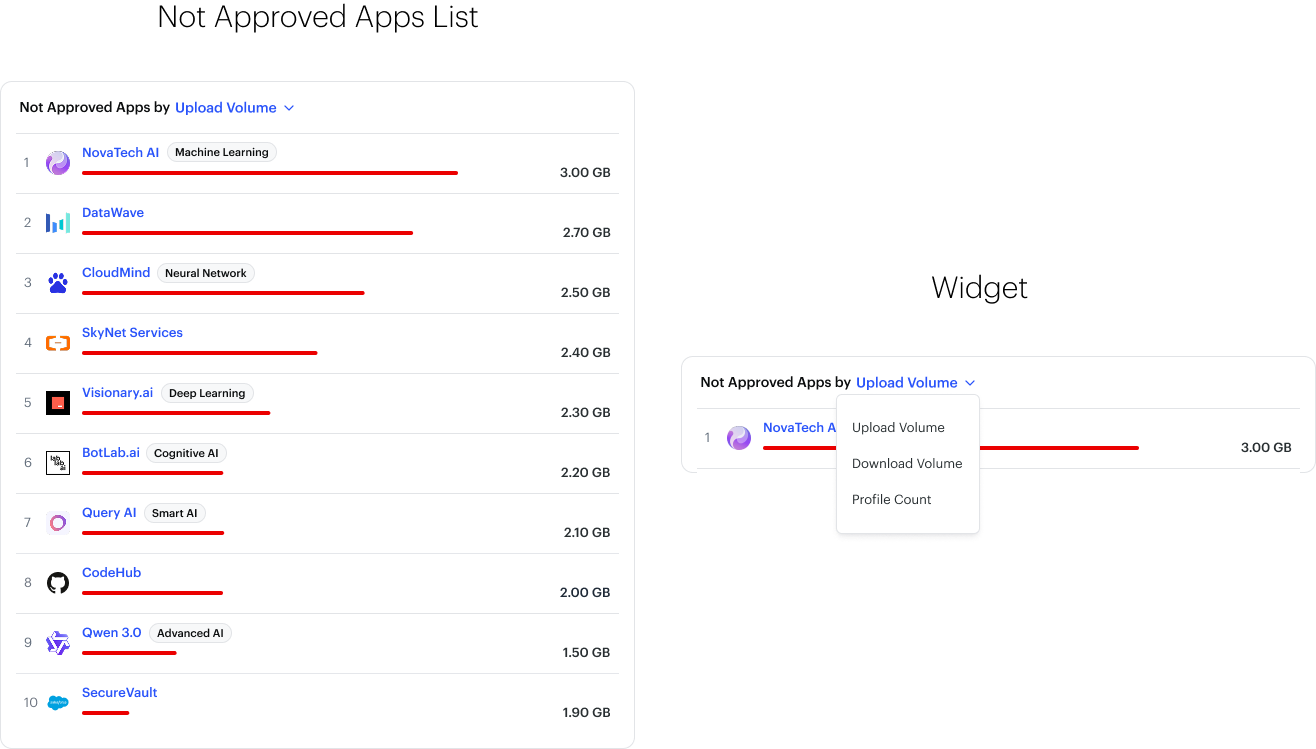
4. Creating flexible data exploration patterns (multi-dimensional tables with dynamic sorting)Researching
industry platforms (e.g. Palo Alto, Wiz) to align with enterprise expectations

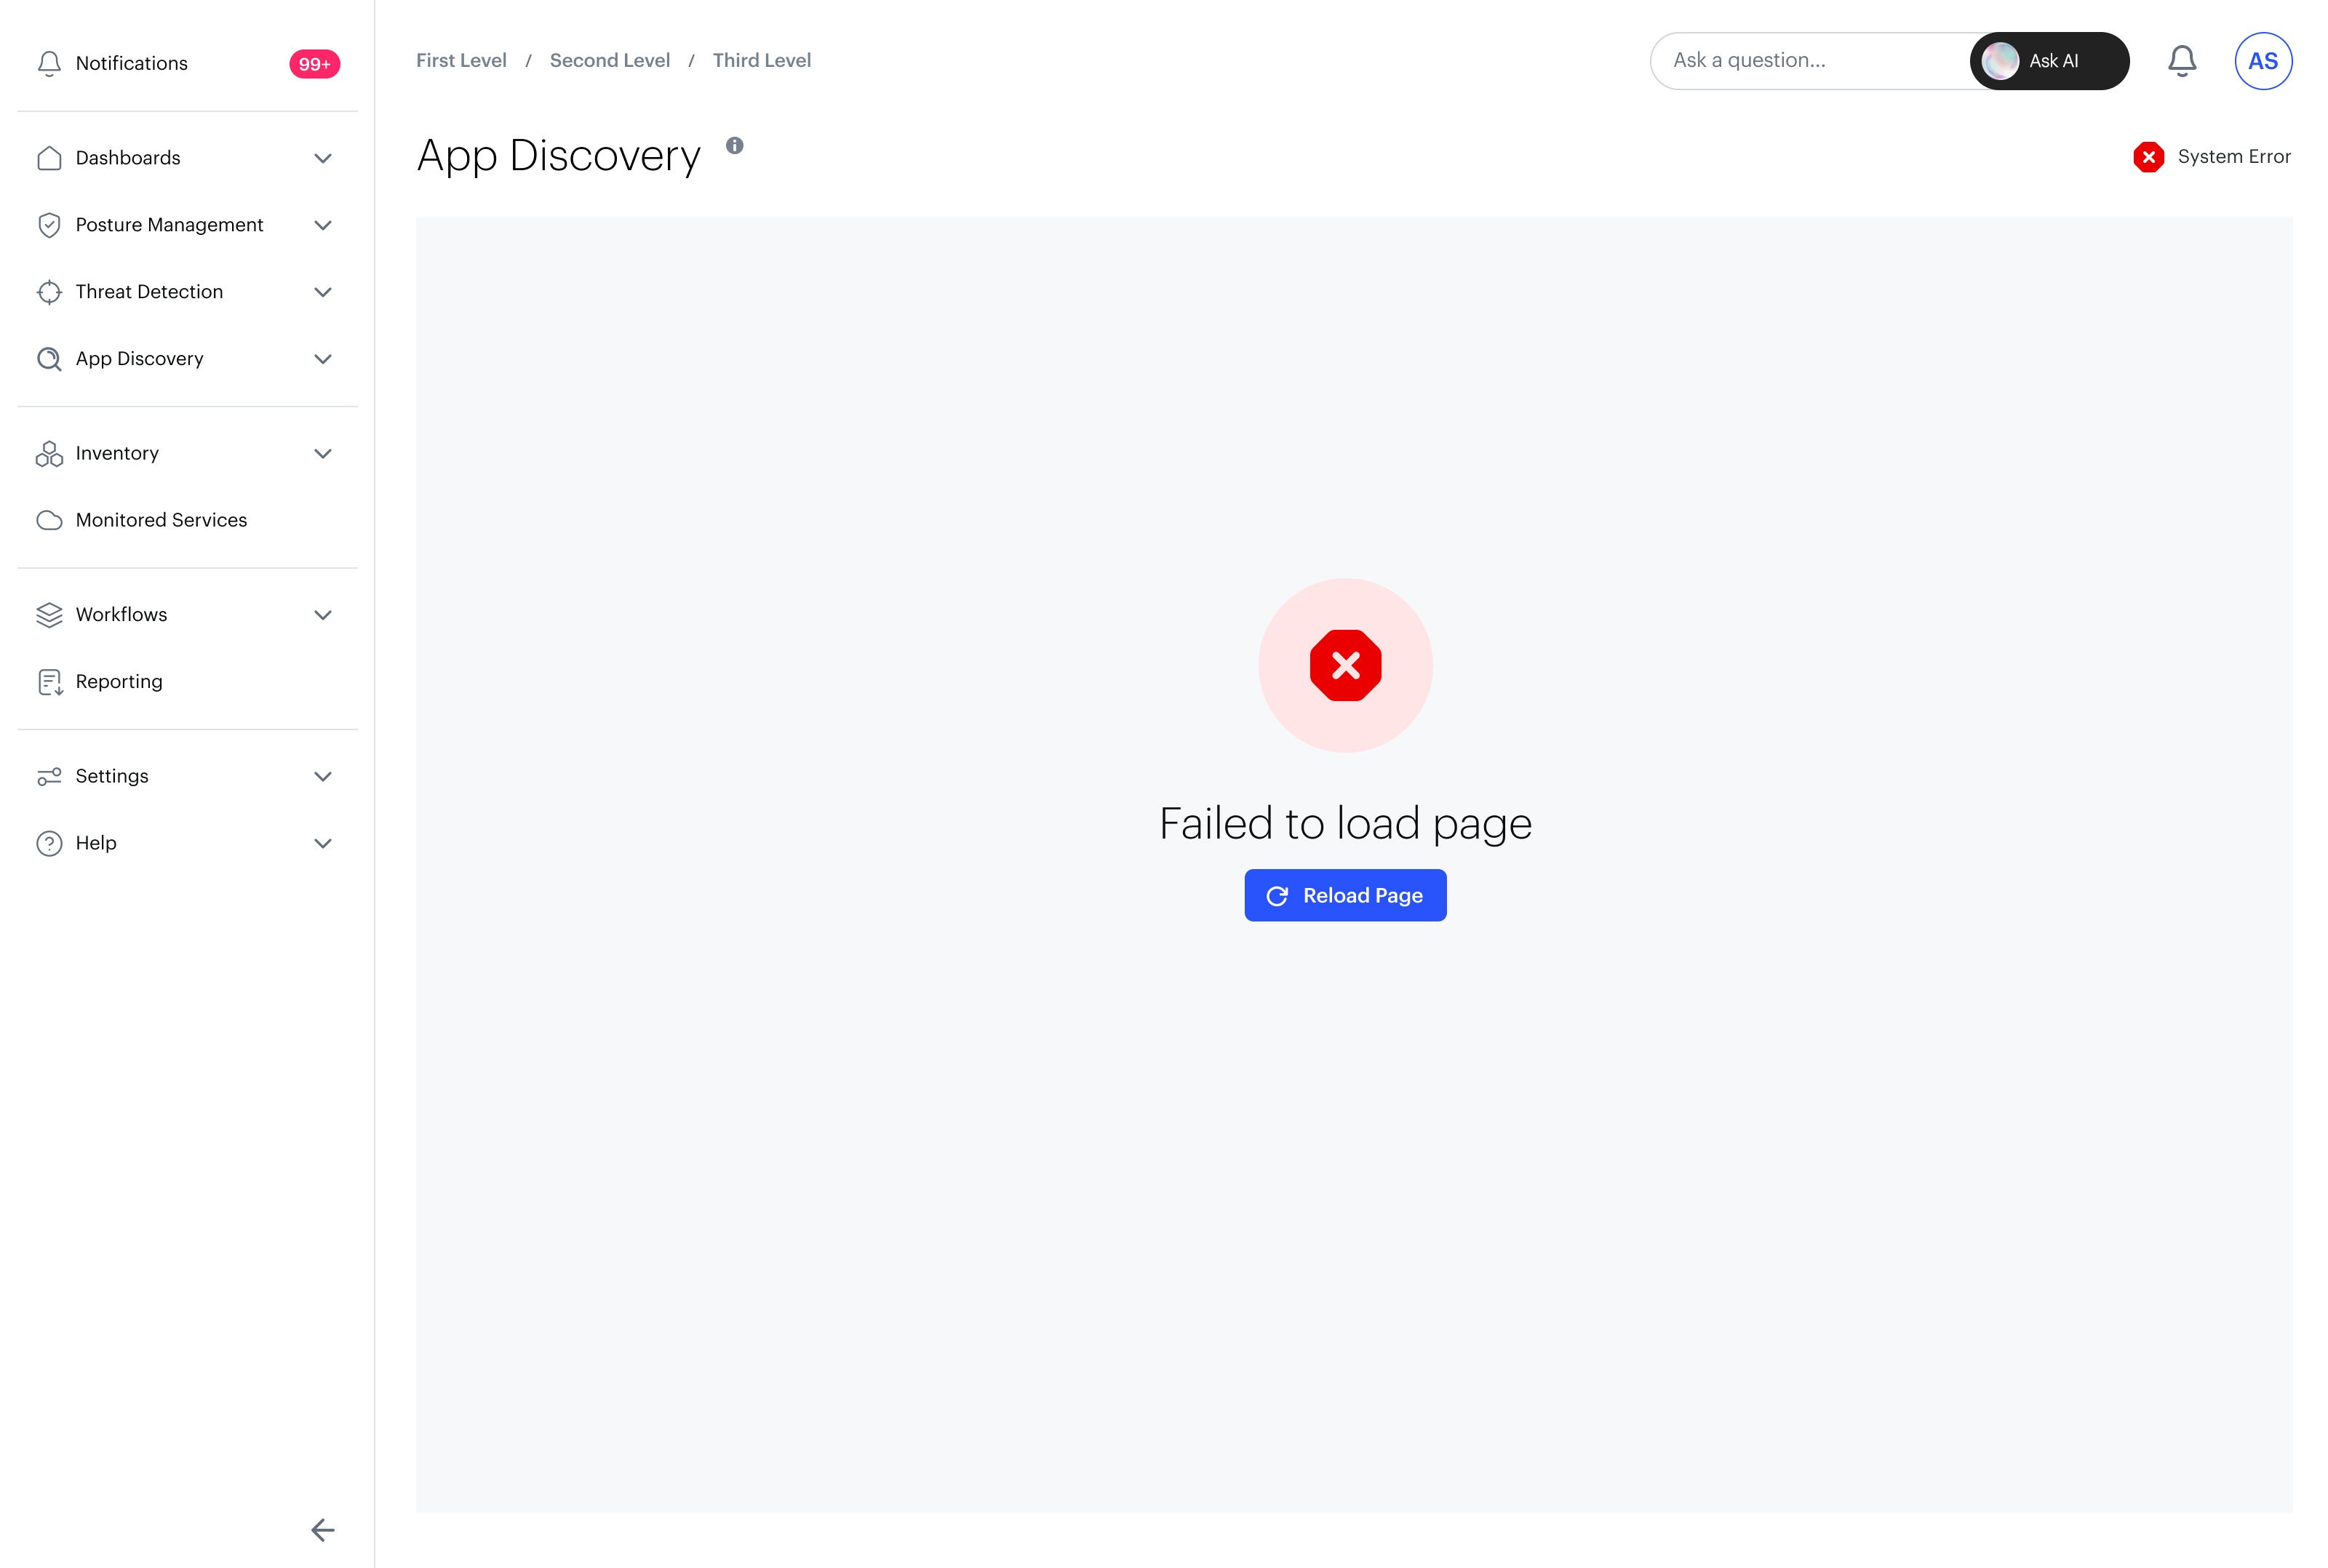
5. Designing for multiple system states (active, syncing, failure) to ensure operational clarity

The result was a system that bridges the gap between raw telemetry and decision-making, helping security teams identify risk faster and act with confidence.

My Role: Product Designer (UX) with Product Ownership

  • Led UX strategy and design for the Workflows platform
  • Owned information architecture, interaction models, and system-level UX
  • Partnered deeply with PM and Engineering on sequencing and feasibility
  • Drove product vision for workflow unification and extensibility
  • Designed for enterprise customers including Google, Accenture, Barclays, PepsiCo, and Principal
  • Acted in a PM-capacity for nearly a year, shaping scope, prioritization, and rollout phases

The Problem Statement

Enterprise organizations lack visibility into SaaS applications used across their workforce, especially those accessed through browsers.

This creates several challenges:

1. Shadow IT risk — unknown or unreviewed applications being used

2. Data exposure risk — files uploaded to unapproved or high-risk apps

3. Operational blind spots — difficulty prioritizing what to review or investigate

4. Fragmented insights — data exists, but is scattered across multiple views

Solution Overview

We designed a SaaS Visibility & Risk Intelligence Dashboard that transforms raw browser data into actionable insights.

The system enables security teams to discover SaaS applications used across the organization, identify unreviewed and unapproved apps, track data movement (uploads/downloads) and monitor risk levels to prioritize investigations.

A key innovation was the introduction of an AI-powered insights layer, which surfaces the most critical risks without requiring manual analysis.

1. Landing Experience: From Data to Immediate Insight

I designed the landing experience to surface the most critical information upfront, without requiring users to navigate across multiple views.

Landing page

AI-Powered Summary Layer

At the top of the page, I introduced an AI-powered summary layer. Instead of showing raw numbers, this component translates system activity into clear, actionable insights.

This allows security teams to immediately understand where risk exists — whether it is high-risk applications being accessed, unusual data activity, or a growing backlog of unreviewed apps.

Widget for High-Level Operational Metrics

On the left, I designed a set of high-level operational metrics that provide immediate visibility into system activity.

The unreviewed apps widget highlights not only the total count, but also surfaces newly discovered applications within the week, along with visual indicators for high-risk entries. This ensures that emerging risks are not lost within aggregate data.

Alongside this, the profiles metric reflects how many identities are interacting with applications. I intentionally moved toward the concept of profiles instead of users, to better represent real-world scenarios where a single individual may operate across multiple identities or email accounts.

Widget for Distribution Visualization

On the right side, I designed a status distribution visualization that provides a holistic view of the SaaS ecosystem.

This component shows the relationship between approved, unapproved, and unreviewed applications, allowing security teams to quickly assess how much of their SaaS usage is actually governed.

The goal of this layout was simple:

Allow security teams to understand their entire SaaS risk posture within seconds of landing on the page.

2. Prioritizing Risk Through Multi-Dimensional Analysis

Security teams need to answer questions such as:

- Which applications are most widely used?

- Where is data being uploaded?

- Which apps pose the highest risk?

To enable this, I designed two data tables that allow users to analyze applications based on different dimensions.

The first table focuses on unreviewed applications, while the second focuses on applications that have been explicitly not approved.

Table for Unreviewed Apps With Inline Widget

Tabke for Not Approved Apps With Inline Widget

Rather than forcing users into separate views for each type of analysis, I introduced an inline control within each table that allows them to dynamically switch the context of the data using options for Upload Volume, Download Volume and Profile Count.

This allows security teams to shift their perspective instantly, without leaving the page.

Table Row Component

Each row in the table is designed to be both informative and scannable. It includes the application’s identity, classification tags such as AI or LLM-based tools, and a visual representation of usage, allowing users to quickly compare applications relative to each other.

Sync in Progress - Designing for System Transparency

Failure State

Product Impact & Business Outcomes

From a product standpoint, this new feature is positioned as a separate SKU within the AppOmni platform, and has been successfully adopted by enterprise customers — including multiple Fortune 500 organizations — as an upsell to existing security modules.

This project reflects how I approach product design: Not as an interface problem, but as a system for decision-making.

By combining data modeling, UX design, and product thinking, I helped transform raw browser telemetry into a scalable risk intelligence capability — one that supports enterprise adoption, drives product value, and enables security teams to act with confidence.

The feature expands AppOmni’s value from configuration and identity security to continuous SaaS usage intelligence, strengthening the platform’s role in enterprise security operations.

Early adoption of the system has demonstrated strong impact. For customers using the feature, it has enabled:

1. Discovery of hundreds of previously unknown applications across enterprise environments

2. Reduction in unreviewed application backlog by 20–40% through improved prioritization

3. Identification of high-risk application usage across critical user groups

4. Visibility into data movement patterns, including uploads to unapproved applicationsFaster time to identify and investigate potential security risks

Schedule Meeting
Let’s
connect.